Cartographic generalization: prioritizing features with QRank (Feb 3, 2024)
(Return to the blog homepage.)
Cartographic generalization is how a mapmaker picks what to show a user on a map when the map just isn't big enough to show it all.
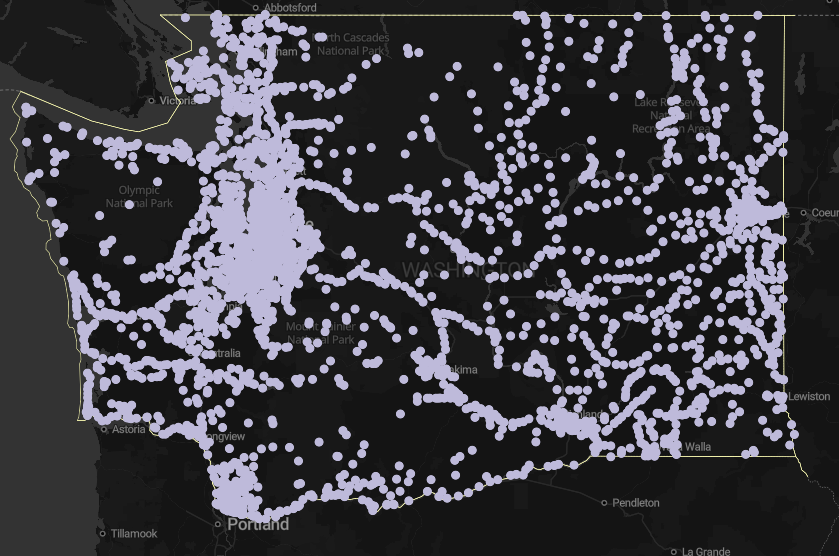
Consider a map of Washington state. If we were to show all the key:place nodes, even without labels, it's a big mess, with many overlapping places:
This post will explore how to do simple generalization using tilemaker and Wikidata's QRank data.
The map schema and styles
All the maps on this page use the same style, and (mostly!) the same, simple schema:
Schema
The schema declares two layers:
boundaries, which contains state boundaries as linesplaces, which contains places (e.g., villages, towns, cities) as points
Style
The style:
- draws the state boundary
- labels as many places as it can
Attempt 1: Simplest possible thing (cities)
Hey, maybe we don't need to do any generalization. Let's write a Lua profile that emits the state boundary and all the place nodes.
Maybe it just works, looks great, and we can knock off for the day. The Lua looks like this:
node_keys = {'place'}

function node_function()
	local name = Find('name')
	if name == '' then return end

	Layer('places')
	Attribute('name', name)
end

function way_function()
end

function relation_scan_function()
	if Find('boundary') == 'administrative' and Find('admin_level') == '4' then
		Accept()
	end
end

function relation_function()
	if Find('boundary') == 'administrative' and Find('admin_level') == '4' then
		Layer('boundaries')
	end
end
We'd expect the map is not going to look great... and, well, see for yourself:
Attempt 2: Limit the number of features (cities-limit)
One obvious problem with the previous map: there are way too many places labelled at low zooms.
Adjust the places layer to have feature_limit and feature_limit_below settings:
"places": {
    "zindex": 2,
    "minzoom": 6,
    "maxzoom": 10,
    "feature_limit": 5,
    "feature_limit_below": 10
}
This tells tilemaker to put at most 5 places in each tile. If the user wants to see more, they can zoom in. It's a little better:
Attempt 3: Use OSM tags to prioritize features
Now that the map isn't cluttered, we can actually read all the labels.
And we notice that many that we'd expect are missing:
- Seattle, home of Starbucks, multiple pro sports teams and a popular setting for films
- Redmond, home of Microsoft
- Olympia, the capital of Washington state
- Forks, setting of the popular Twilight series
- Spokane, a major population centre in eastern Washington
It'd be reasonable if some are missing... but in fact, they're all missing. What gives?
tilemaker is simply taking 5 arbitrary items for its feature limit. We need to tell tilemaker how to rank the features.
Let's rework our node_function to use the place=* tag -- items with a higher ZOrder value will be preferred by tilemaker:
function node_function()
	local name = Find('name')
	if name == '' then return end

	Layer('places')
	Attribute('name', name)
	local rank = 1
	local place = Find('place')
	if place == 'hamlet' then rank = 2 end
	if place == 'town' then rank = 3 end
	if place == 'village' then rank = 4 end
	if place == 'city' then rank = 5 end
	ZOrder(rank)
end
...giving us this map:
Looking better! The big cities we care about are present -- Seattle, Tacoma and Spokane.
There are still some issues:
- Olympia, the state capital, is missing, despite being a
place=city. Surely it's more important than Yakima or Vancouver. - The west coast of Washington fits in a tile that has no cities. Thus, we see
place=villageitems like Wa'atch and Moclips. They stick out by comparison to proper cities like Seattle.
Maybe we could add some heuristics to resolve these concerns:
- Maybe we could give cities a boost based on population. D'oh--Olympia is smaller than both Yakima and Vancouver.
- Olympia has the
capital=4tag, indicating that it's a state capital. Maybe we could give any capital a boost. - Maybe we could say that no
place=villageshould ever be visible at low zooms.
But as we start to explore that, it feels like we'll always have to tweak rules. Maybe some place=villages are noteworthy enough to appear at low zooms, for example.
Worse, what happens when we think about other features we might like to show on the map? All of our rules are place specific. They won't generalize to mountain peaks, bodies of water, etc.
Attempt 4: Use QRank to prioritize features
Luckily, there's another option. Many OSM items are linked to a Wikidata item. Many of those items are linked to Wikipedia pages.
Could we drive feature selection by how much "mindshare" the feature has, as measured by visits to Wikipedia?
Yes! It turns out to be straight-forward. Wikimedia hosts the Wikidata QRank project. It's a CSV with scores for many Wikidata items, based on pageviews. I host a QRank SQLite db and qrank lua module that provide for easy integration into tilemaker.
Let's adjust our node_function further:
function node_function()
  if Find('place') == 'state' then return end
	local name = Find('name')
	if name == '' then return end

	Layer('places')
	Attribute('name', name)
	ZOrder(qrank.get(Find('wikidata')))
end
Now our map looks like:
Hmmmm. On the one hand, Forks and Olympia now appear. That's excellent.
On the other hand, Index, Aberdeen, and Cheney now also appear. Unfortunately, this seems to be a downside of QRank: it confuses things with similar names. The Wikipedia page for Index is a disambiguation page, with one of the options being the page for Index, WA. I suspect QRank is summing up the popularity of all of the entries on the disambiguation page, giving Index, WA an unfair advantage over other cities. I imagine Aberdeen is getting a boost from its much more famous Scottish peer, and Cheney a boost from a former US politician.
Perhaps someone will come along and fix QRank? Until then, it seems like we'll still need some hand-tuned heuristics.
Conclusion
Generalization is necessary to avoid a cluttered map. Ranking and limiting the number of features shown is one possible generalization technique. The ranking can either be based on a rules system, or based on an external signal of importance.
In both cases, you'll often need a human in the loop who actually looks at the result and makes some judgment calls about whether it's good enough.
The code for this post is available on GitHub at is available at hikeratlas/qrank-demo.